The National Bureau of Statistics released a series of data Tuesday on China's economic and social development since the 18th National Congress of the Communist Party of China (CPC) held in 2012.
The data came ahead of the 19th CPC National Congress, which is scheduled to open on Oct. 18.[Special coverage]
The following are facts and figures from the report:
GDP:
-- GDP expanded by an average annual rate of 7.2 percent during 2013-2016, compared with 2.6-percent average global growth and the 4-percent growth of developing economies.
-- Calculated at 2015 prices, average annual GDP growth was valued at 4.44 trillion yuan (670 billion U.S. dollars) in 2013-2016.
-- In H1 2017, GDP growth was 6.9 percent, within the 6.7-6.9 percent range for eight quarters in a row.
-- China's 2016 GDP of 11.2 trillion dollars accounted for 14.8 percent of the world economy, up 3.4 percentage points from 2012.
-- China's average contribution to world growth in 2013-2016 was about 30 percent, the largest among all countries and higher than the total contribution from the United States, the eurozone and Japan.
Employment:
-- China created more than 13 million new urban jobs annually for four consecutive years in 2013-2016. New jobs created in the first eight months of this year stood at 9.74 million.
-- The surveyed unemployment rate in 31 large cities was about 5 percent. In September, the figure was 4.83 percent, the lowest since 2012.
-- The number of rural residents working in cities rose at an annual rate of 1.8 percent in 2013-2016.
Innovation:
-- Research and development (R&D) expenditures rose 52.2 percent from 2012 to 1.57 trillion yuan in 2016. The share of R&D spending in GDP rose from 1.91 percent to 2.11 percent in the same period.
-- Thanks to reforms to simplify business registration and streamline approvals, the number of new companies registered in 2014-2016 totaled 13.62 million, an annual increase of 30 percent. In the first eight months, 3.99 million companies were registered.
-- The number of patent applications China received in 2016 rose 69 percent from 2012, while the number of patents granted rose 39.7 percent from 2012.
Structure:
-- The share of service output in GDP rose from 45.3 percent in 2012, to 51.6 percent in 2016. In H1 2017, service output accounted for 54.1 percent of GDP.
-- From 2013 to 2016, the service industry grew by an annual rate of 8 percent, 0.8 percentage point faster than average GDP growth. Service output expanded 7.7 percent year on year in H1 2017.
-- The contribution of final consumption to economic growth averaged 55 percent in 2013-2016. In H1, the contribution of final consumption to economic growth stood at 63.4 percent.
-- At the end of 2016, the ratio of permanent urban residents to total population stood at 57.35 percent at the end of 2016, up from 52.57 percent at the end of 2012.
Environment:
-- From 2012 to 2016, energy and water use per unit of GDP dropped 17.9 percent and 25.3 percent, respectively. In H1, energy use per unit of GDP dropped 3.9 percent year on year.
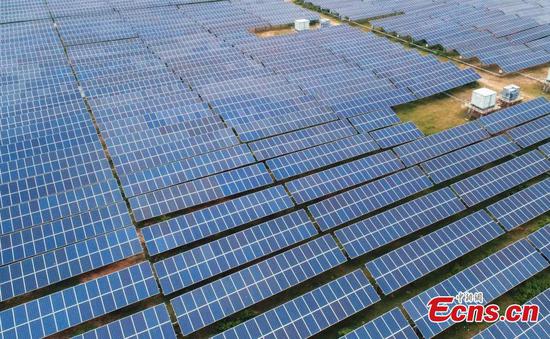
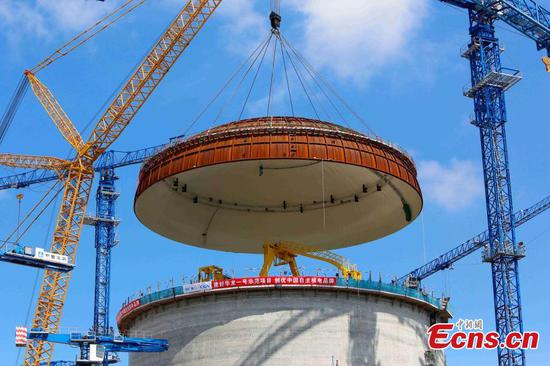
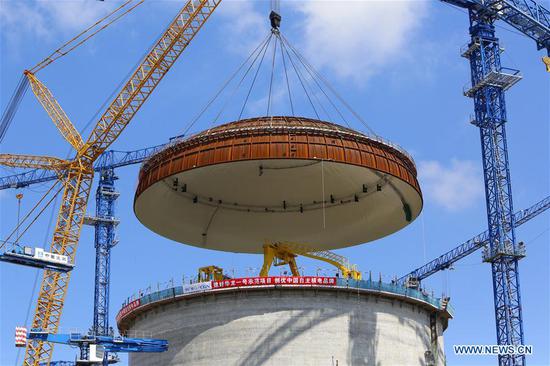
-- At the end of 2016, the installed nuclear power capacity rose 167.6 percent from 2012, in-grid wind power capacity rose 140.1 percent and in-grid solar power capacity surged 21.4 times from 2012.
-- PM2.5 density in 338 cities dropped 6 percent year on year in 2016 and by 2.3 percent in the first eight months.
-- The total area of new forests stood at 7.2 million hectares in 2016, up 28.7 percent from 2012.
Opening up:
-- The value of goods trade stood at 24.3 trillion yuan in 2016, accounting for more than 11 percent of total global trade volume.
-- The value of service trade was 657.5 billion dollars, up 36.8 percent from 2012, representing an average annual growth of 8.1 percent.
-- Foreign direct investment rose by an annual rate of 3.1 percent to 489.4 billion dollars in 2013-2016.
-- Non-financial outbound direct investment rose by an average rate of 21.6 percent to 491.5 billion dollars in 2013-2016.
People's lives:
-- The per-capita disposable income of all residents rose from 7,311 yuan in 2012 to 23,821 yuan in 2016, an annual increase of 7.4 percent. The figure for H1 2017 rose 7.3 percent year on year.
-- The number of rural people living in poverty dropped to 43.35 million last year, from 98.99 million in 2012.
-- The disposable income per capita of rural residents in poor areas rose 10.7 percent on average in 2013-2016, faster than the 8 percent for all rural residents.
-- The average life expectancy rose from 74.83 years in 2010 to 76.34 years in 2015.


